Components of a Line Graph
When it comes to understanding and interpreting line graphs, it is essential to grasp the key components that make up these visual representations of data.
X-Axis and Y-Axis
The X-axis and Y-axis are the two fundamental components of a line graph. The X-axis, also known as the horizontal axis, typically represents the independent variable, while the Y-axis, or the vertical axis, represents the dependent variable. In simpler terms, the X-axis shows the data categories or labels, while the Y-axis displays the numerical values being measured.
Data Points and Lines
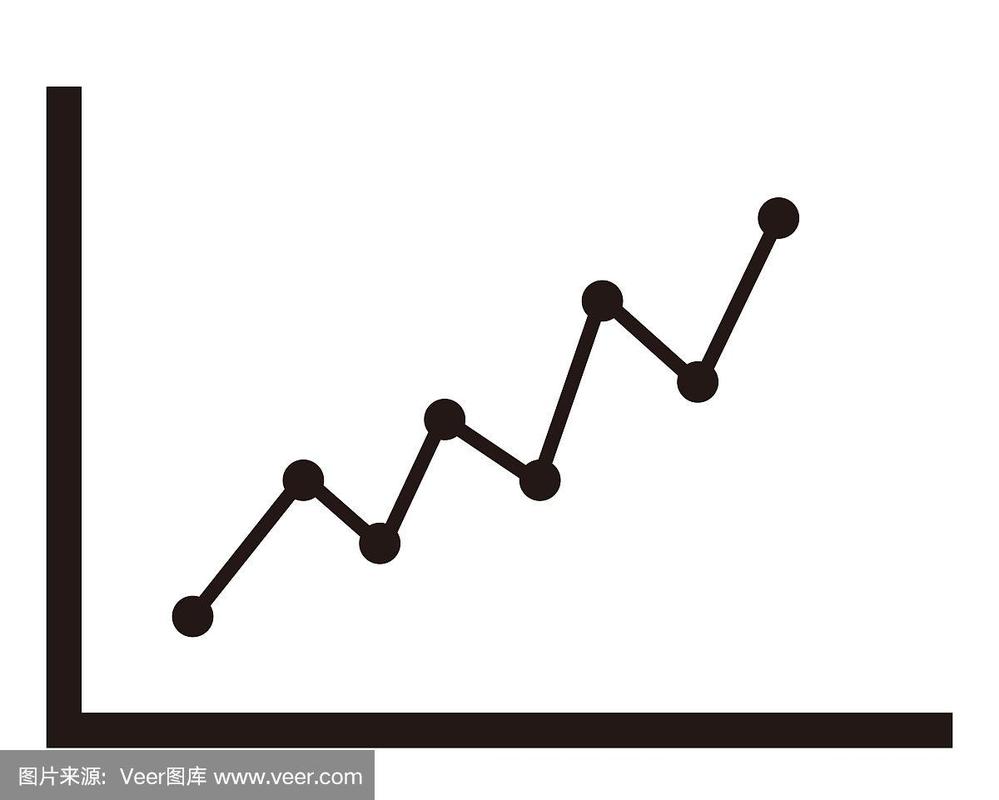
Data points are individual values plotted on the graph, usually represented by markers such as dots or crosses. These data points are then connected by lines to create the visual representation of the data trends. The lines in a line graph help to illustrate the continuous flow or progression of the data between data points, making it easier to identify patterns and trends.
Understanding the relationship between the X-axis and Y-axis, as well as the significance of data points and lines, is crucial in effectively interpreting the information presented in a line graph. These components work together to provide a clear and concise representation of data, making it easier for viewers to draw conclusions and insights from the graph.
How to Create a Line Graph
Creating a line graph is a straightforward process that involves selecting the right data and setting up the graph with the appropriate scale.
Choosing the Right Data
The first step in creating a line graph is to carefully select the data that you want to represent. It is essential to choose data that can effectively showcase the trends or patterns you are trying to communicate. Ensure that the data is relevant, accurate, and aligned with the purpose of your graph. By selecting the right data, you can create a graph that effectively conveys the message you intend to deliver.
Selecting the Appropriate Scale
Once you have identified the data to include in your line graph, the next step is to select the appropriate scale for the axes. The scale determines the range and intervals represented on the X-axis and Y-axis. It is crucial to choose a scale that clearly presents the data without distortion or misrepresentation. Consider the range of values in your data set and adjust the scale to accommodate these values effectively. A well-chosen scale ensures that the data points are spread out evenly and that trends are clearly visible on the graph.
By carefully selecting the right data and setting up the graph with an appropriate scale, you can create a line graph that effectively communicates the information you want to convey. Paying attention to these key steps ensures that your graph is accurate, easy to read, and provides valuable insights to viewers.
Interpreting Line Graphs
When it comes to interpreting line graphs, it's essential to understand the trends and patterns depicted in the data as well as how to analyze the individual data points.
Trends and Patterns
One of the primary aspects of interpreting a line graph is identifying trends and patterns present in the data. Trends refer to the general direction in which the data is moving over a period of time, whether it's increasing, decreasing, or remaining constant. Patterns, on the other hand, encompass recurring shapes or sequences within the data points that can provide additional insights into the underlying factors at play. By keenly observing the trends and patterns in a line graph, viewers can grasp the overall story the data is telling and make informed interpretations.
Analyzing Data Points
In addition to recognizing trends and patterns, analyzing individual data points is crucial for a deeper understanding of the information presented in a line graph. Each data point represents a specific value or observation at a given point in time, contributing to the overall shape of the line. By examining the data points closely, viewers can identify outliers, anomalies, or significant fluctuations that may require further investigation. Understanding the nuances of individual data points allows for a more nuanced interpretation of the data and helps uncover any underlying factors driving the trends depicted in the graph.
By paying attention to the trends and patterns exhibited in the data as well as analyzing individual data points, viewers can gain valuable insights from line graphs and make informed decisions based on the information presented.
Advantages of Using Line Graphs
Line graphs offer several advantages that make them a popular choice for visualizing data in various fields.
Visual Representation of Data
One significant advantage of using line graphs is their ability to provide a clear and visually appealing representation of data. The continuous line that connects data points can help viewers easily track trends and changes over time. This visual representation makes it simple to identify patterns, compare data sets, and draw conclusions about the relationship between different variables. By presenting data in a graphical format, line graphs make it easier for users to interpret complex information quickly and efficiently.
Comparing Multiple Data Sets
Another advantage of line graphs is their effectiveness in comparing multiple data sets simultaneously. By plotting multiple lines on the same graph, users can visually compare different variables or datasets with ease. This feature is particularly useful when analyzing trends, relationships, or patterns across various categories or groups. Whether showcasing sales figures for different products, comparing temperature trends in various cities, or tracking the progress of multiple projects over time, line graphs enable users to compare and contrast data effectively.
In conclusion, the visual representation of data and the ability to compare multiple data sets make line graphs a valuable tool for data analysis and decision-making in various fields. Understanding the advantages of using line graphs can empower users to effectively communicate information, identify trends, and make data-driven decisions in their respective domains.
Common Mistakes to Avoid when Using Line Graphs
Line graphs are powerful tools for visualizing data, but there are common mistakes that people often make when creating or interpreting them. By being aware of these pitfalls, users can enhance the effectiveness of their line graphs and ensure that the data is accurately represented.
Overcrowding the Graph
One common mistake when using line graphs is overcrowding the graph with too much information. When there are too many data points, multiple lines, or excessive text on the graph, it can become cluttered and difficult to read. This can confuse the viewer and make it challenging to identify trends or patterns in the data. To avoid this mistake, users should aim to keep the graph clean and uncluttered, focusing on presenting the essential information clearly.
Incorrect Scaling
Another common mistake is using incorrect scaling on the axes of the graph. Choosing the wrong scale can distort the data and make it challenging to interpret the information accurately. Users should carefully select the appropriate scale for the X and Y axes to ensure that the data is presented in a clear and meaningful way. By using a consistent and appropriate scale, users can avoid misrepresenting the data and make it easier for viewers to understand the information being presented.
Missing Labels and Titles
One critical mistake to avoid when using line graphs is omitting labels and titles. Without clear labels for the axes, data points, or lines, viewers may struggle to understand the information being displayed. Additionally, the lack of a descriptive title can make it unclear what the graph is illustrating. To prevent confusion and ensure clarity, users should always include descriptive labels for the axes, data points, and lines, as well as a clear and informative title that summarizes the content of the graph.
In summary, avoiding common mistakes such as overcrowding the graph, using incorrect scaling, and missing labels and titles can help users create effective and accurate line graphs. By being mindful of these potential pitfalls, users can maximize the impact of their graphs and communicate data clearly and efficiently.